tti.utils usage examples
Below is an example on how to use the fillMissingValues function of the tti.utils package.
Usage example
"""
Trading-Technical-Indicators (tti) python library

File name: utils_example.py
    Example code for the Fill Missing Values function.

Data files used:
- example_data_missing_1.csv: Missing data at the beginning of the file.
- example_data_missing_1.csv: Missing data at the end of the file.
- example_data_missing_1.csv: Missing data at several places in the file.
"""

import pandas as pd
import matplotlib.pyplot as plt
from tti.utils import fillMissingValues

for data_file in ['example_data_missing_1.csv', 'example_data_missing_2.csv',
                'example_data_missing_3.csv']:

    # Read data from csv file. Set the index to the correct column
    df = pd.read_csv('./data/' + data_file, parse_dates=True, index_col=0)

    # Fill missing values using the fillMissingValues exposed function
    filled_df = fillMissingValues(df)

    # Create a dataframe with original and modified values, for plotting the
    # changes

    df = pd.concat([filled_df, df], axis=1)
    df.columns = ['After', 'Before']

    # Plot the updates on the data
    plt.plot(df.index, df['After'], label='Filled Values', color='tomato',
            linestyle='--', linewidth=1, alpha=1.0)
    plt.plot(df.index, df['Before'], label='Before', color='limegreen',
            linestyle='-', linewidth=1, alpha=1.0)
    plt.grid(which='major', axis='y', alpha=0.5)
    plt.xlabel('Date', fontsize=11, fontweight='bold')
    plt.ylabel('Price', fontsize=11, fontweight='bold')
    plt.title('Fill Missing Values', fontsize=11, fontweight='bold')
    plt.gcf().autofmt_xdate()
    plt.legend(loc=0)
    plt.savefig('./figures/' + data_file.split('.')[0] + '.png')
    plt.clf()

    print('- Graph', './figures/' + data_file.split('.')[0] + '.png', 'saved.')
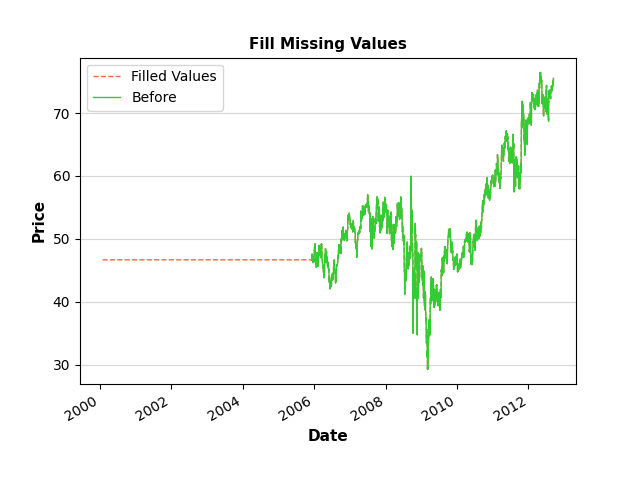
Result after filling the missing data at the beginning of a file.
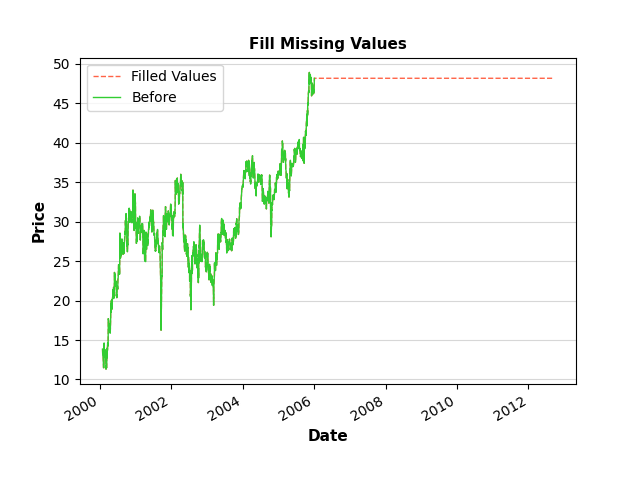
Result after filling the missing data at the end of a file.
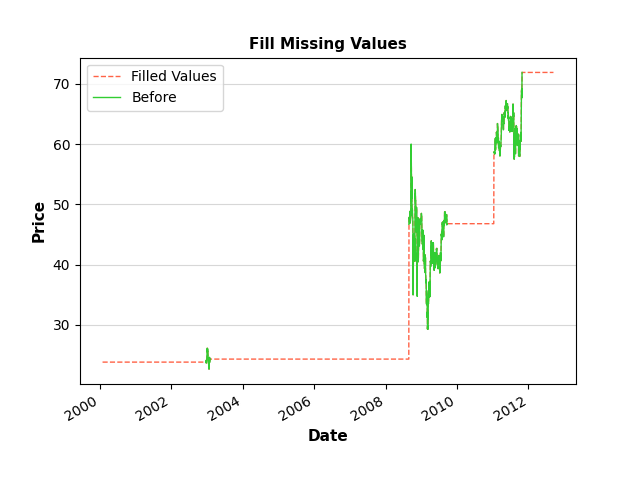
Result after filling the missing data at several places of a file.